
Photo Credit: insta_photos / Shutterstock
As COVID-19 cases decline again, many public health restrictions are lifted, and more of life returns to normal, one interesting question for the months and years ahead is how the pandemic will permanently affect people’s habits and lifestyle.
One example is fitness and physical activity. With many gyms, pools, and other recreational facilities closed or operating at limited capacity in 2020, the early COVID-19 pandemic raised concerns that lockdowns would decrease levels of physical activity. One study conducted early in the pandemic found that overall physical activity for adults was significantly lower than prior to the pandemic. Meanwhile, many at-home fitness products and services that boomed during the pandemic now face an uncertain future; while some consumers may be returning to their old gyms, others may simply be losing interest.
The questions of whether and how much people are exercising post-pandemic are important because maintaining adequate levels of physical activity is a key component of individual and public health. Experts have identified a number of benefits associated with a physically active lifestyle, including reduced blood pressure, improved mood and energy levels, and better sleep. Physically active people are at lower risk for heart disease, type 2 diabetes, and even some types of cancers. The Center for Disease Control (CDC) found that a lack of physical activity contributes to 10% of all premature deaths in the U.S.

Additional data from the CDC appears to confirm how physical activity is associated with a reduction in other potential health risks. According to CDC data, the share of adults in each city who report being physically active has negative correlations with the share of adults reporting chronic health problems like obesity, diabetes, and high cholesterol. There are strong negative correlations for the incidences of obesity and diabetes, while the incidence of high cholesterol shows a more moderate relationship.
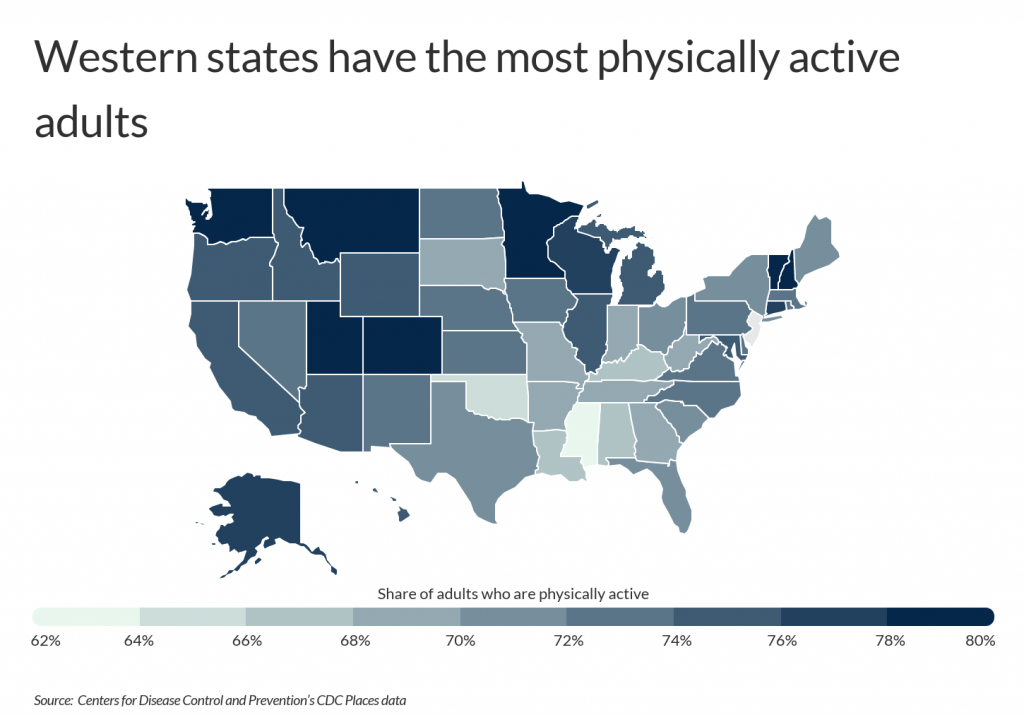
The share of adults who report engaging in physical activity also varies widely across states, with highly active states found in several regions of the country. Leading states for physically active adults include Colorado (80.9%), Washington (80.6%), Minnesota, (80.3%), and Vermont (79.8%). In contrast, states in the South show lower levels of physical activity. Southern locations like Mississippi (61.2%), Oklahoma (65%), Kentucky (66.6%), and Louisiana (67.5%) report the lowest levels of activity among their residents. While many of the most active states have excellent natural resources suited to active outdoor lifestyles, a more likely explanation is each state’s income levels. Research has found a correlation between higher levels of income and physical activity, and many top states have higher typical incomes than their less active peers. At the local level, many of the most active cities are found in these same active states, including metros like Seattle, Denver, and Minneapolis.
The data used in this analysis is from the Centers for Disease Control and Prevention’s PLACES: Local Data for Better Health. To determine the most physically active locations, researchers at ChamberOfCommerce.org calculated the share of adults who self-reported engaging in leisure-time physical activity such as running, calisthenics, golf, gardening, or walking for exercise. For context, researchers also included statistics on obesity, high cholesterol, diabetes, and depression.
Here are the most physically active cities.
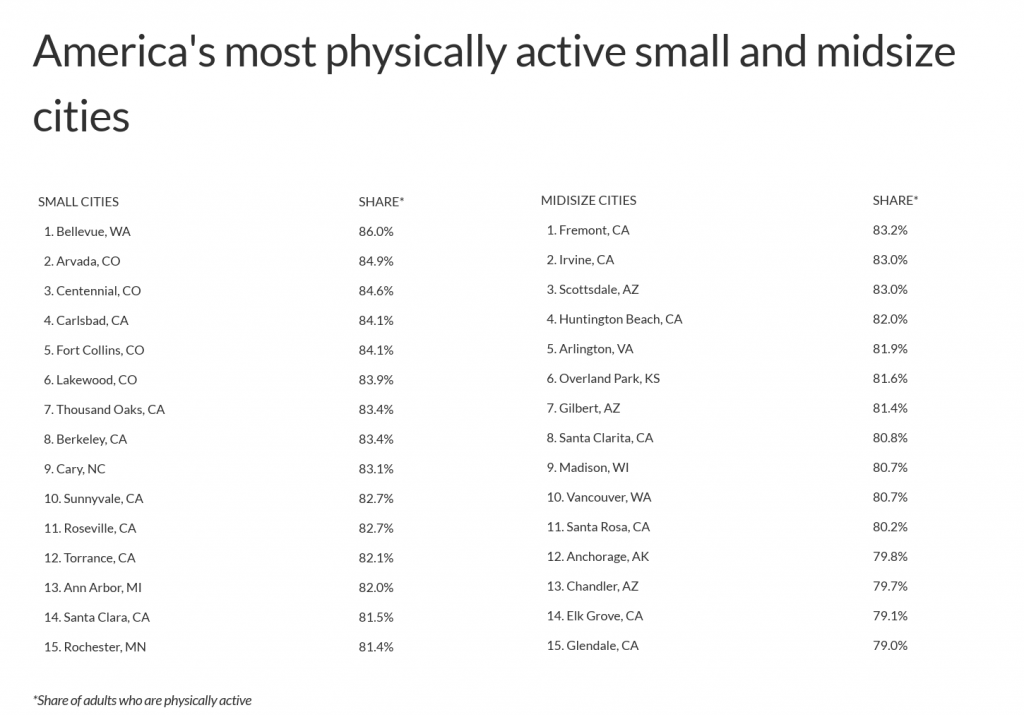
America’s Most Physically Active Large Cities

Photo Credit: Ingus Kruklitis / Shutterstock
15. Long Beach, CA
- Share of adults who are physically active: 75.3%
- Share of adults who are obese: 27.5%
- Share of adults with high cholesterol: 27.2%
- Share of adults with diabetes: 10.5%
- Share of adults with depression: 15.5%

Photo Credit: digidreamgrafix / Shutterstock
14. Charlotte, NC
- Share of adults who are physically active: 76.8%
- Share of adults who are obese: 29.5%
- Share of adults with high cholesterol: 29.2%
- Share of adults with diabetes: 10.7%
- Share of adults with depression: 20.8%

Photo Credit: cdrin / Shutterstock
13. Oakland, CA
- Share of adults who are physically active: 77.2%
- Share of adults who are obese: 27.6%
- Share of adults with high cholesterol: 27.3%
- Share of adults with diabetes: 10.8%
- Share of adults with depression: 16.3%
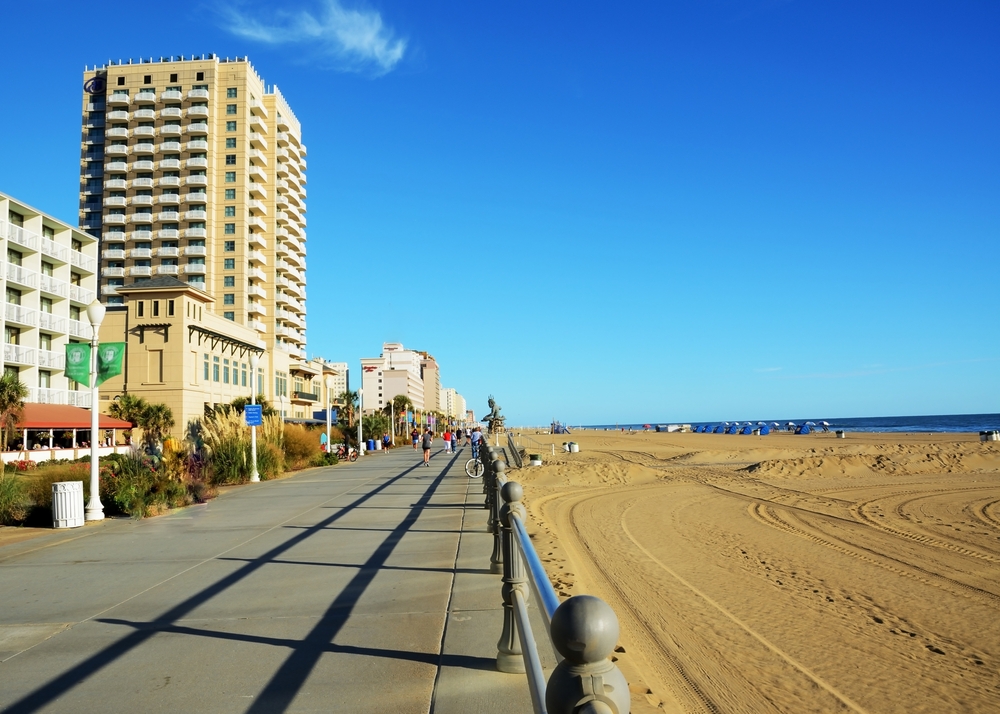
Photo Credit: Alexandr Junek Imaging / Shutterstock
12. Virginia Beach, VA
- Share of adults who are physically active: 77.4%
- Share of adults who are obese: 30.4%
- Share of adults with high cholesterol: 29.0%
- Share of adults with diabetes: 8.9%
- Share of adults with depression: 19.4%
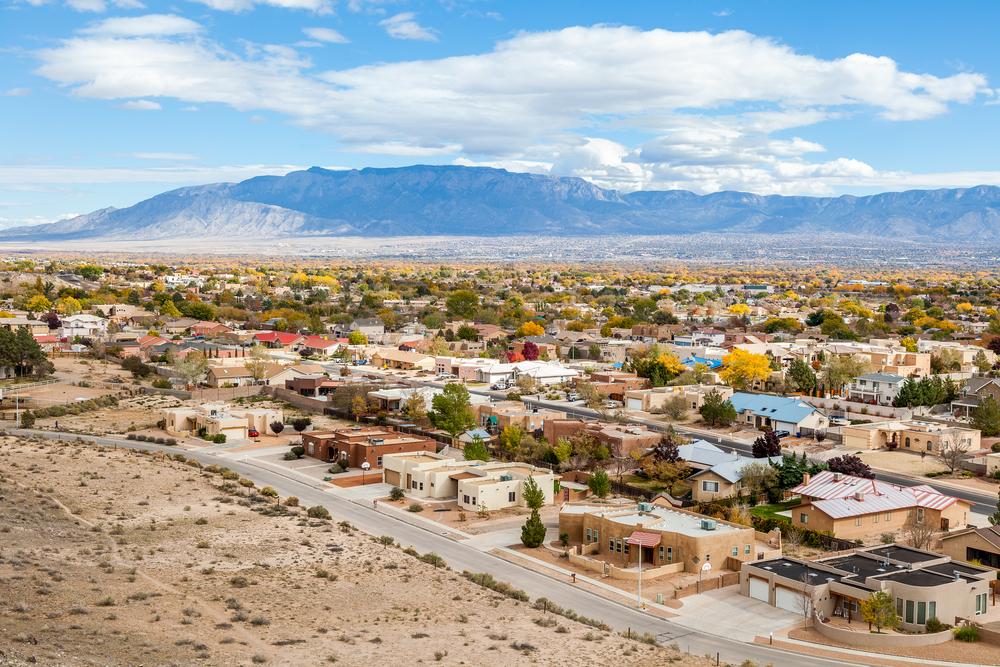
Photo Credit: turtix / Shutterstock
11. Albuquerque, NM
- Share of adults who are physically active: 77.4%
- Share of adults who are obese: 27.8%
- Share of adults with high cholesterol: 25.5%
- Share of adults with diabetes: 9.4%
- Share of adults with depression: 19.0%
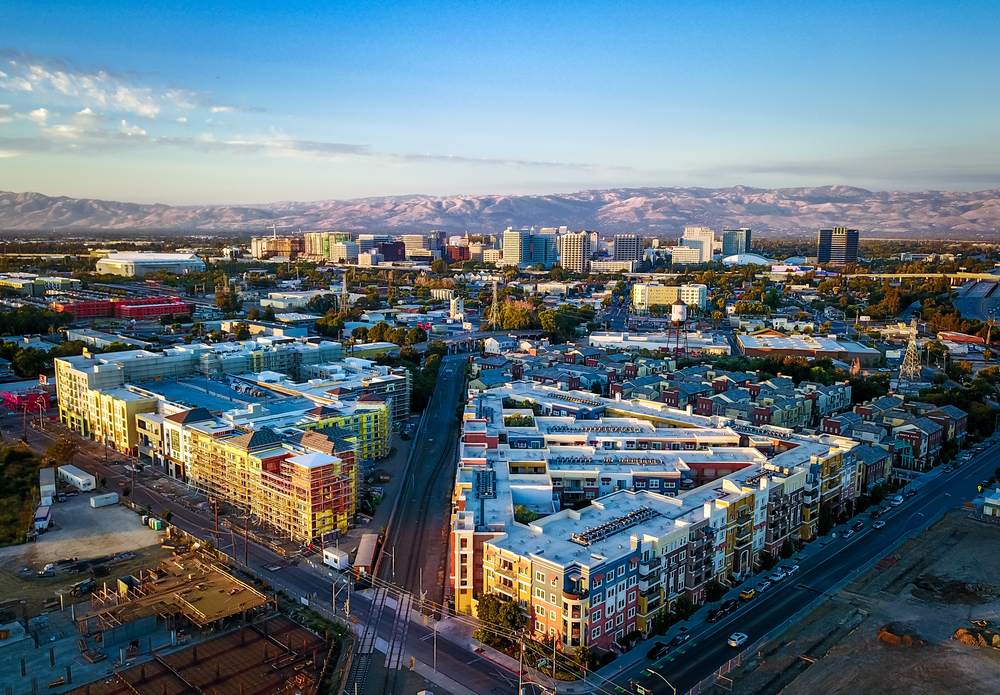
Photo Credit: Uladzik Kryhin / Shutterstock
10. San Jose, CA
- Share of adults who are physically active: 77.7%
- Share of adults who are obese: 22.0%
- Share of adults with high cholesterol: 25.5%
- Share of adults with diabetes: 9.3%
- Share of adults with depression: 13.6%

Photo Credit: Farid Sani / Shutterstock
9. Raleigh, NC
- Share of adults who are physically active: 78.1%
- Share of adults who are obese: 30.5%
- Share of adults with high cholesterol: 28.9%
- Share of adults with diabetes: 9.6%
- Share of adults with depression: 20.9%

Photo Credit: ShengYing Lin / Shutterstock
8. Austin, TX
- Share of adults who are physically active: 78.5%
- Share of adults who are obese: 25.2%
- Share of adults with high cholesterol: 30.5%
- Share of adults with diabetes: 9.5%
- Share of adults with depression: 19.3%

Photo Credit: Lucky-photographer / Shutterstock
7. San Diego, CA
- Share of adults who are physically active: 78.6%
- Share of adults who are obese: 22.6%
- Share of adults with high cholesterol: 27.3%
- Share of adults with diabetes: 8.9%
- Share of adults with depression: 17.8%

Photo Credit: Bob Pool / Shutterstock
6. Portland, OR
- Share of adults who are physically active: 79.8%
- Share of adults who are obese: 25.9%
- Share of adults with high cholesterol: 25.8%
- Share of adults with diabetes: 7.4%
- Share of adults with depression: 25.6%

Photo Credit: photo.ua / Shutterstock
5. Colorado Springs, CO
- Share of adults who are physically active: 80.1%
- Share of adults who are obese: 24.4%
- Share of adults with high cholesterol: 28.8%
- Share of adults with diabetes: 7.2%
- Share of adults with depression: 20.1%

Photo Credit: Nicholas Courtney / Shutterstock
4. Denver, CO
- Share of adults who are physically active: 80.9%
- Share of adults who are obese: 22.0%
- Share of adults with high cholesterol: 26.2%
- Share of adults with diabetes: 7.7%
- Share of adults with depression: 18.4%

Photo Credit: Bogdan Vacarciuc / Shutterstock
3. San Francisco, CA
- Share of adults who are physically active: 80.9%
- Share of adults who are obese: 16.1%
- Share of adults with high cholesterol: 26.8%
- Share of adults with diabetes: 9.1%
- Share of adults with depression: 14.5%

Photo Credit: Checubus / Shutterstock
2. Minneapolis, MN
- Share of adults who are physically active: 81.1%
- Share of adults who are obese: 27.5%
- Share of adults with high cholesterol: 25.7%
- Share of adults with diabetes: 8.8%
- Share of adults with depression: 22.8%

Photo Credit: Jeremy Janus / Shutterstock
1. Seattle, WA
- Share of adults who are physically active: 84.7%
- Share of adults who are obese: 22.1%
- Share of adults with high cholesterol: 27.3%
- Share of adults with diabetes: 7.4%
- Share of adults with depression: 23.5%
Detailed Findings & Methodology
The data used in this analysis is from the Centers for Disease Control and Prevention’s CDC Places data. To determine the most physically active locations, researchers calculated the share of adults who self-reported engaging in leisure-time physical activity such as running, calisthenics, golf, gardening, or walking for exercise. In the event of a tie, the location with the lower share of adults who are obese (BMI ≥30.0) was ranked higher. To improve relevance, only cities with at least 100,000 residents were included. Additionally, cities were grouped into cohorts based on population size: small (100,000–149,999), midsize (150,000–349,999), and large (350,000 or more).


