Photo Credit: afotostock / Shutterstock
According to recently released data from the U.S. Census Bureau, total construction spending in the United States amounted to $917.4 billion during the first six months of 2023. While this total only represents a 2.5% inflation-adjusted increase over the same period in 2022, inflation-adjusted construction spending has increased by over 16.5% from the same period in 2020—when the onset of the COVID-19 pandemic halted economic activity, disrupted supply chains, and dramatically altered spending patterns.
A major portion of this increased construction spending is attributable to heightened investment in the residential housing sector. After over a decade of underinvestment in new residential housing—as a result of the subprime mortgage crisis and housing market crash—new housing starts have steadily increased. And although rising interest rates are taking a toll on the economy as a whole, there have been signs of growth in new housing construction.

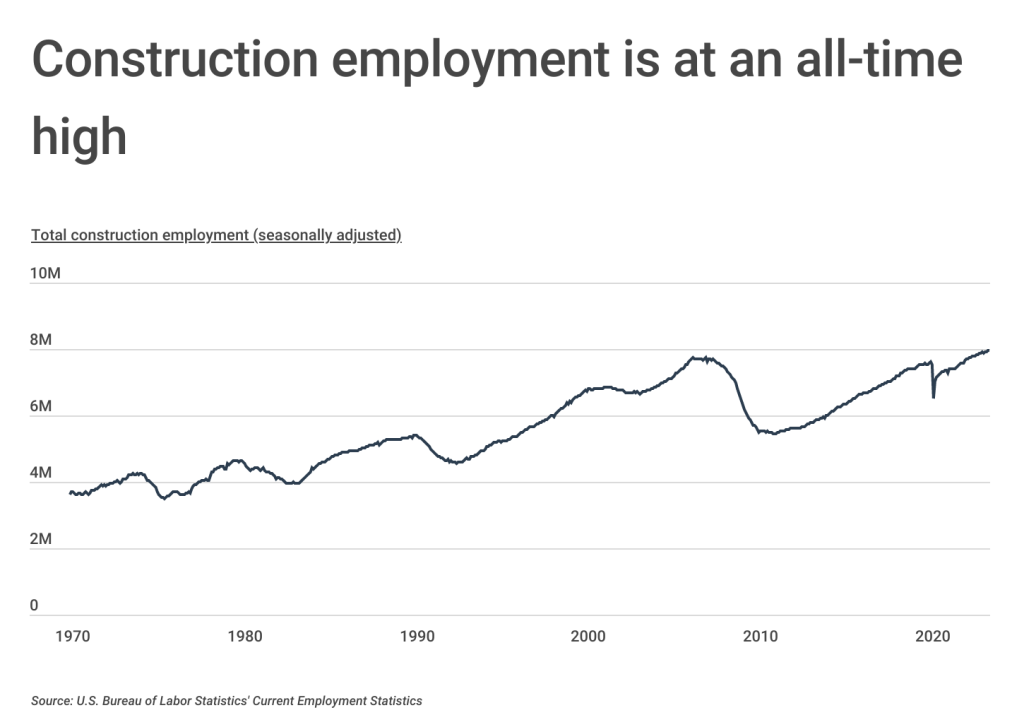
Increased spending in the residential housing sector and across the construction industry as a whole also bodes well for construction employment. After a sharp decline during the pandemic where total construction employment sank to 6.5 million, employment in the construction industry has steadily grown. In fact, employment in the sector has surpassed pre-COVID levels, and as of July 2023, there were over 7.9 million people employed in construction, an all-time high.

Demand for construction workers translates to strong wages. The construction industry generally compensates its workers well, especially when considering that few construction occupations require a postsecondary degree. On a national level, full- and part-time wage and salary construction workers earn a median of $50,570 per year, which is about 9% more than the median wage of $46,310 for all occupations.
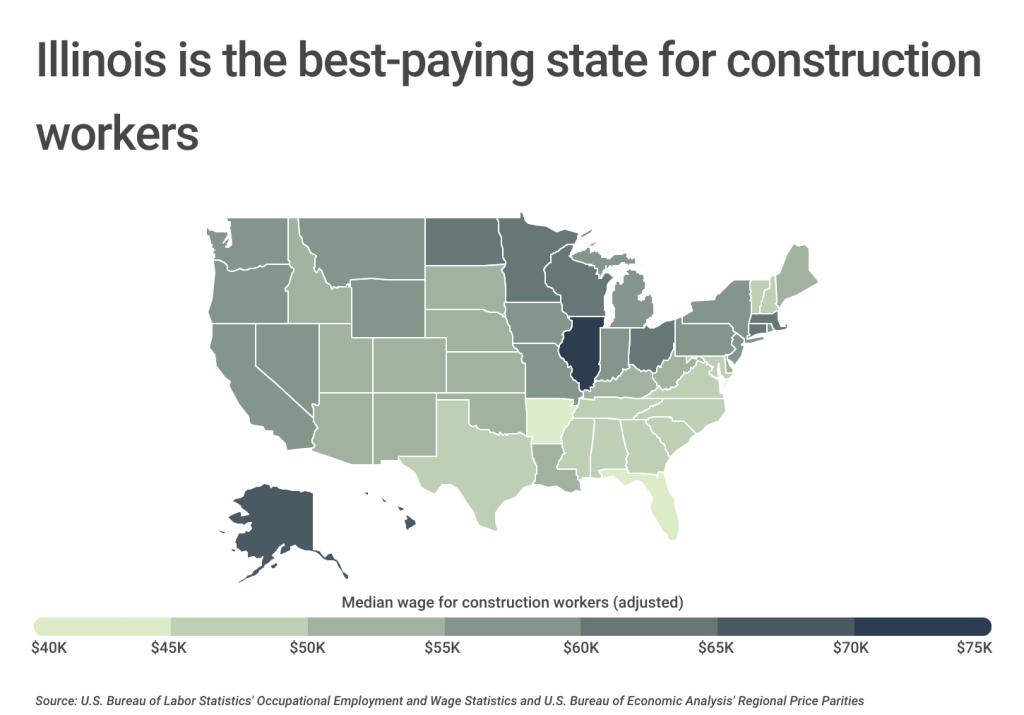
At the state level, the Midwest is home to some of the highest wages for construction workers after adjusting for cost of living. Illinois leads the country with a cost-of-living adjusted median annual wage of $73,630, with Minnesota ($63,390), North Dakota ($62,336), Wisconsin ($61,877), and Ohio ($61,141) all ranking among the top 10 states. Conversely, the South has the lowest cost-of-living adjusted wages for construction workers. In fact, the South accounts for all of the bottom 10 states for this ranking, with Arkansas ($44,217), Florida ($44,602), and Alabama ($45,961) providing the lowest adjusted wages for construction workers in the country.
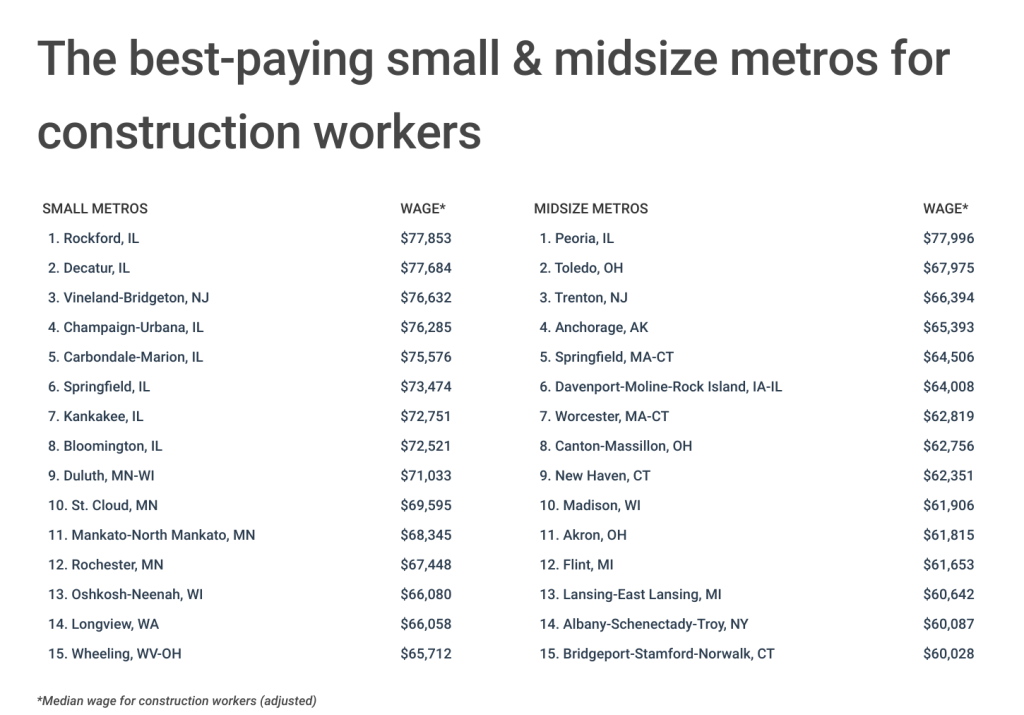
These trends also hold true at the metropolitan level. To determine the best-paying metros for construction workers, researchers at Construction Coverage, a website that provides construction insurance guides, analyzed the latest data from the U.S. Bureau of Labor Statistics, the U.S. Bureau of Economic Analysis, and the U.S. Census Bureau. The researchers ranked metropolitan areas according to the cost-of-living adjusted median annual wage for construction workers. For the purposes of this analysis, construction workers were considered to be all wage and salary workers for nonfarm establishments with occupations classified under the Construction and Extraction Occupations major occupation group. In the event of a tie, the location with the larger unadjusted median annual wage for construction workers was ranked higher.
Here are the best-paying U.S. metropolitan areas for construction workers.

The Best-Paying Large Metros for Construction Workers

Photo Credit: Sean Pavone / Shutterstock
15. Kansas City, MO-KS
- Median wage for construction workers (adjusted): $60,824
- Median wage for construction workers (unadjusted): $56,970
- Median wage for all workers (unadjusted): $46,410
- Number of construction workers: 41,450
- Cost of living: 6.3% below average

Photo Credit: f11photo / Shutterstock
14. Pittsburgh, PA
- Median wage for construction workers (adjusted): $60,828
- Median wage for construction workers (unadjusted): $57,880
- Median wage for all workers (unadjusted): $45,870
- Number of construction workers: 48,740
- Cost of living: 4.8% below average

Photo Credit: f11photo / Shutterstock
13. Hartford-West Hartford-East Hartford, CT
- Median wage for construction workers (adjusted): $61,890
- Median wage for construction workers (unadjusted): $62,950
- Median wage for all workers (unadjusted): $52,980
- Number of construction workers: 16,440
- Cost of living: 1.7% above average

Photo Credit: Ingus Kruklitis / Shutterstock
12. New York-Newark-Jersey City, NY-NJ-PA
- Median wage for construction workers (adjusted): $62,166
- Median wage for construction workers (unadjusted): $71,230
- Median wage for all workers (unadjusted): $57,390
- Number of construction workers: 289,730
- Cost of living: 14.6% above average

Photo Credit: Sean Pavone / Shutterstock
11. Cleveland-Elyria, OH
- Median wage for construction workers (adjusted): $62,557
- Median wage for construction workers (unadjusted): $58,930
- Median wage for all workers (unadjusted): $46,800
- Number of construction workers: 28,700
- Cost of living: 5.8% below average

Photo Credit: Jessica Kirsh / Shutterstock
10. San Francisco-Oakland-Hayward, CA
- Median wage for construction workers (adjusted): $62,613
- Median wage for construction workers (unadjusted): $75,030
- Median wage for all workers (unadjusted): $65,520
- Number of construction workers: 90,080
- Cost of living: 19.8% above average

Photo Credit: Agnieszka Gaul / Shutterstock
9. Columbus, OH
- Median wage for construction workers (adjusted): $62,721
- Median wage for construction workers (unadjusted): $59,600
- Median wage for all workers (unadjusted): $46,630
- Number of construction workers: 32,430
- Cost of living: 5.0% below average

Photo Credit: Paul Brady Photography / Shutterstock
8. Milwaukee-Waukesha-West Allis, WI
- Median wage for construction workers (adjusted): $63,087
- Median wage for construction workers (unadjusted): $60,320
- Median wage for all workers (unadjusted): $46,800
- Number of construction workers: 27,020
- Cost of living: 4.4% below average

Photo Credit: mahaloshine / Shutterstock
7. Seattle-Tacoma-Bellevue, WA
- Median wage for construction workers (adjusted): $63,840
- Median wage for construction workers (unadjusted): $73,140
- Median wage for all workers (unadjusted): $61,830
- Number of construction workers: 94,260
- Cost of living: 14.6% above average

Photo Credit: Dave Riewe / Shutterstock
6. Minneapolis-St. Paul-Bloomington, MN-WI
- Median wage for construction workers (adjusted): $64,162
- Median wage for construction workers (unadjusted): $66,460
- Median wage for all workers (unadjusted): $50,960
- Number of construction workers: 72,080
- Cost of living: 3.6% above average

Photo Credit: picsbyst / Shutterstock
5. St. Louis, MO-IL
- Median wage for construction workers (adjusted): $64,429
- Median wage for construction workers (unadjusted): $62,010
- Median wage for all workers (unadjusted): $45,990
- Number of construction workers: 52,030
- Cost of living: 3.8% below average

Photo Credit: Travellaggio / Shutterstock
4. Boston-Cambridge-Nashua, MA-NH
- Median wage for construction workers (adjusted): $66,834
- Median wage for construction workers (unadjusted): $73,310
- Median wage for all workers (unadjusted): $61,090
- Number of construction workers: 95,840
- Cost of living: 9.7% above average

Photo Credit: Uladzik Kryhin / Shutterstock
3. San Jose-Sunnyvale-Santa Clara, CA
- Median wage for construction workers (adjusted): $67,160
- Median wage for construction workers (unadjusted): $74,980
- Median wage for all workers (unadjusted): $76,740
- Number of construction workers: 37,840
- Cost of living: 11.6% above average

Photo Credit: ja-images / Shutterstock
2. Urban Honolulu, HI
- Median wage for construction workers (adjusted): $69,183
- Median wage for construction workers (unadjusted): $79,380
- Median wage for all workers (unadjusted): $49,660
- Number of construction workers: 20,940
- Cost of living: 14.7% above average

Photo Credit: Sean Pavone / Shutterstock
1. Chicago-Naperville-Elgin, IL-IN-WI
- Median wage for construction workers (adjusted): $74,021
- Median wage for construction workers (unadjusted): $78,030
- Median wage for all workers (unadjusted): $48,340
- Number of construction workers: 127,060
- Cost of living: 5.4% above average
Detailed Findings & Methodology
To determine the best-paying metros for construction workers, researchers at Construction Coverage analyzed the latest data from the U.S. Bureau of Labor Statistics’s 2022 Occupational Employment and Wage Statistics, the U.S. Bureau of Economic Analysis’ Regional Price Parities, and the U.S. Census Bureau’s American Community Survey. The researchers ranked metropolitan areas according to the cost-of-living adjusted median annual wage for construction workers. For the purposes of this analysis, construction workers were considered to be all wage and salary workers for nonfarm establishments with occupations classified under the Construction and Extraction Occupations major occupation group. In the event of a tie, the location with the larger unadjusted median annual wage for construction workers was ranked higher.
Only metropolitan areas with available data and with at least 100,000 people were included in the analysis. Cost of living statistics for New England City and Town Areas (NECTAs) were calculated using data for equivalent Metropolitan Statistical Areas (MSAs), where applicable. Additionally, metro areas were grouped into the following cohorts based on population size:
- Small metros: 100,000–349,999
- Midsize metros: 350,000–999,999
- Large metros: 1,000,000 or more
For complete results, see The Best-Paying Cities for Construction Workers on Construction Coverage.


