Millennials today—those born between 1981 and 1996—are in the prime of their lives, and with a population of more than 72 million, they would seem set to be a major force in society and the economy.
But the story is not so simple. Many millennials entered the workforce during or shortly after the Great Recession, when job openings were low and unemployment was high. On top of that, most who attended college experienced dramatic increases in the cost of higher education without proportional rises in wages. More recently, the housing market witnessed exploding costs right as millennials entered peak homebuying age. And while high inflation in the last two years has affected all parts of the economy, younger households have been especially challenged. The economic headwinds facing millennials have meant that members of the generation have, in many respects, fallen behind previous generations in reaching life milestones and creating wealth.
These challenges extend to millennial entrepreneurs. With more personal debt, lower savings and wealth, and other financial difficulties, millennials who are interested in starting or owning a business have more barriers to overcome before doing so.
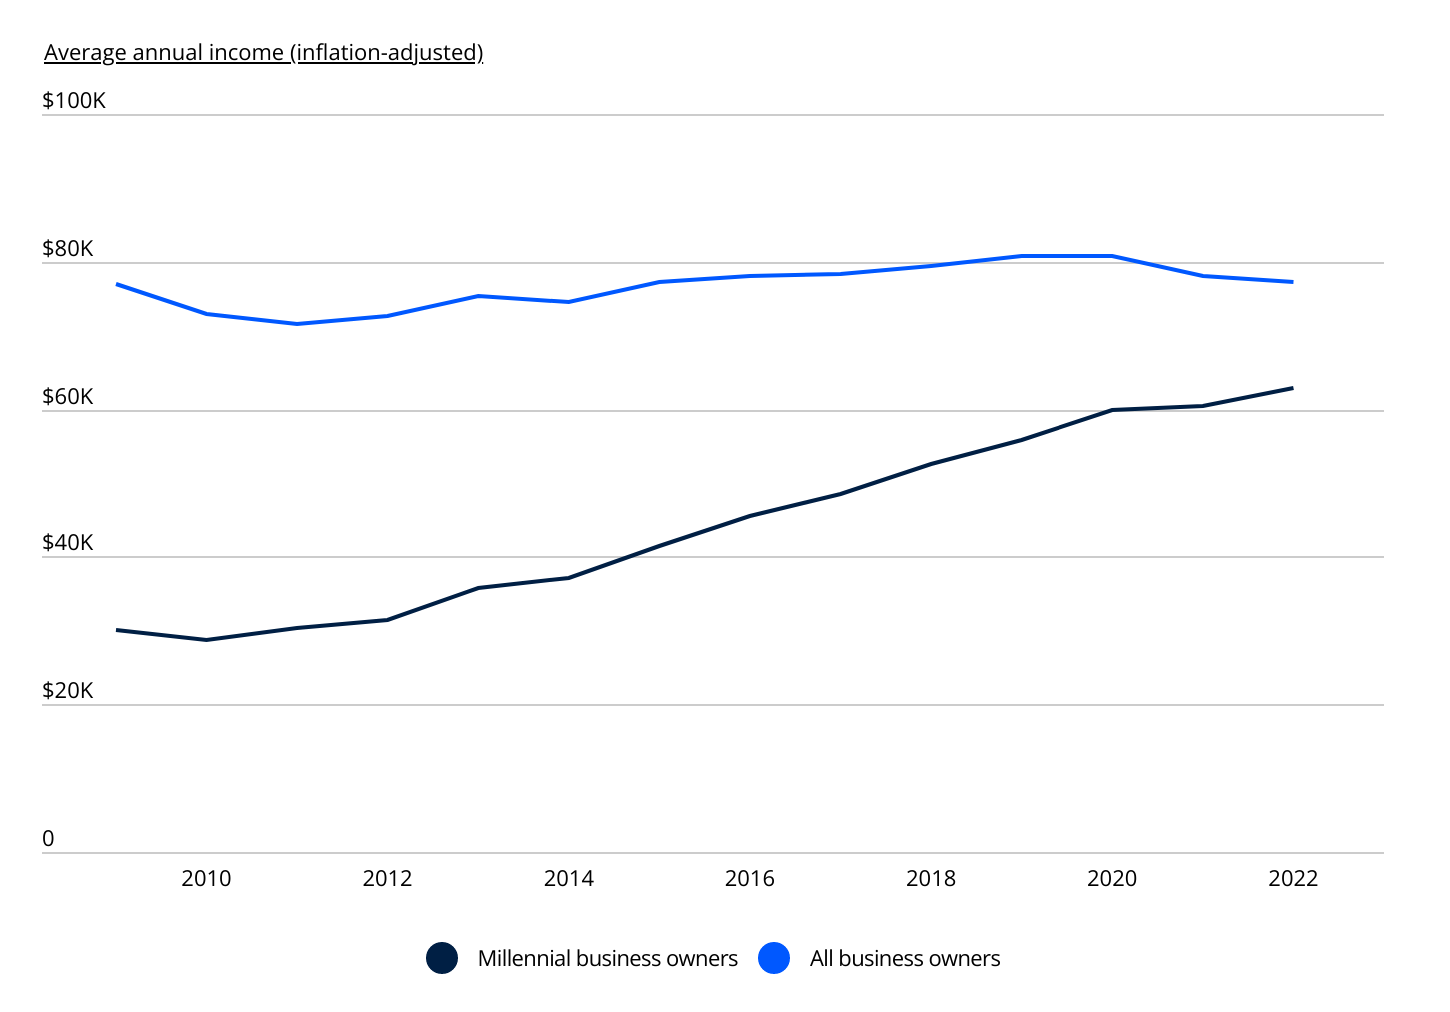
Millennial Business Owner Income Over Time
Millennial business owners have historically earned less than the average business owner
Source: Flippa analysis of U.S. Census Bureau’s American Community Survey data | Image Credit: Flippa
Among business owners, millennials have tended to bring in below-average income. According to the latest Census Bureau data, the average income of all American business owners surpasses that of millennial business owners by roughly $14,000. This discrepancy is partly linked to the younger age of millennials, resulting in newer and less established businesses. However, there’s a positive trend: over time, this gap has diminished. While the income of all business owners has remained relatively steady since 2009, millennial business owners have seen a significant increase, more than doubling from $30,064 to $62,914 during that period.
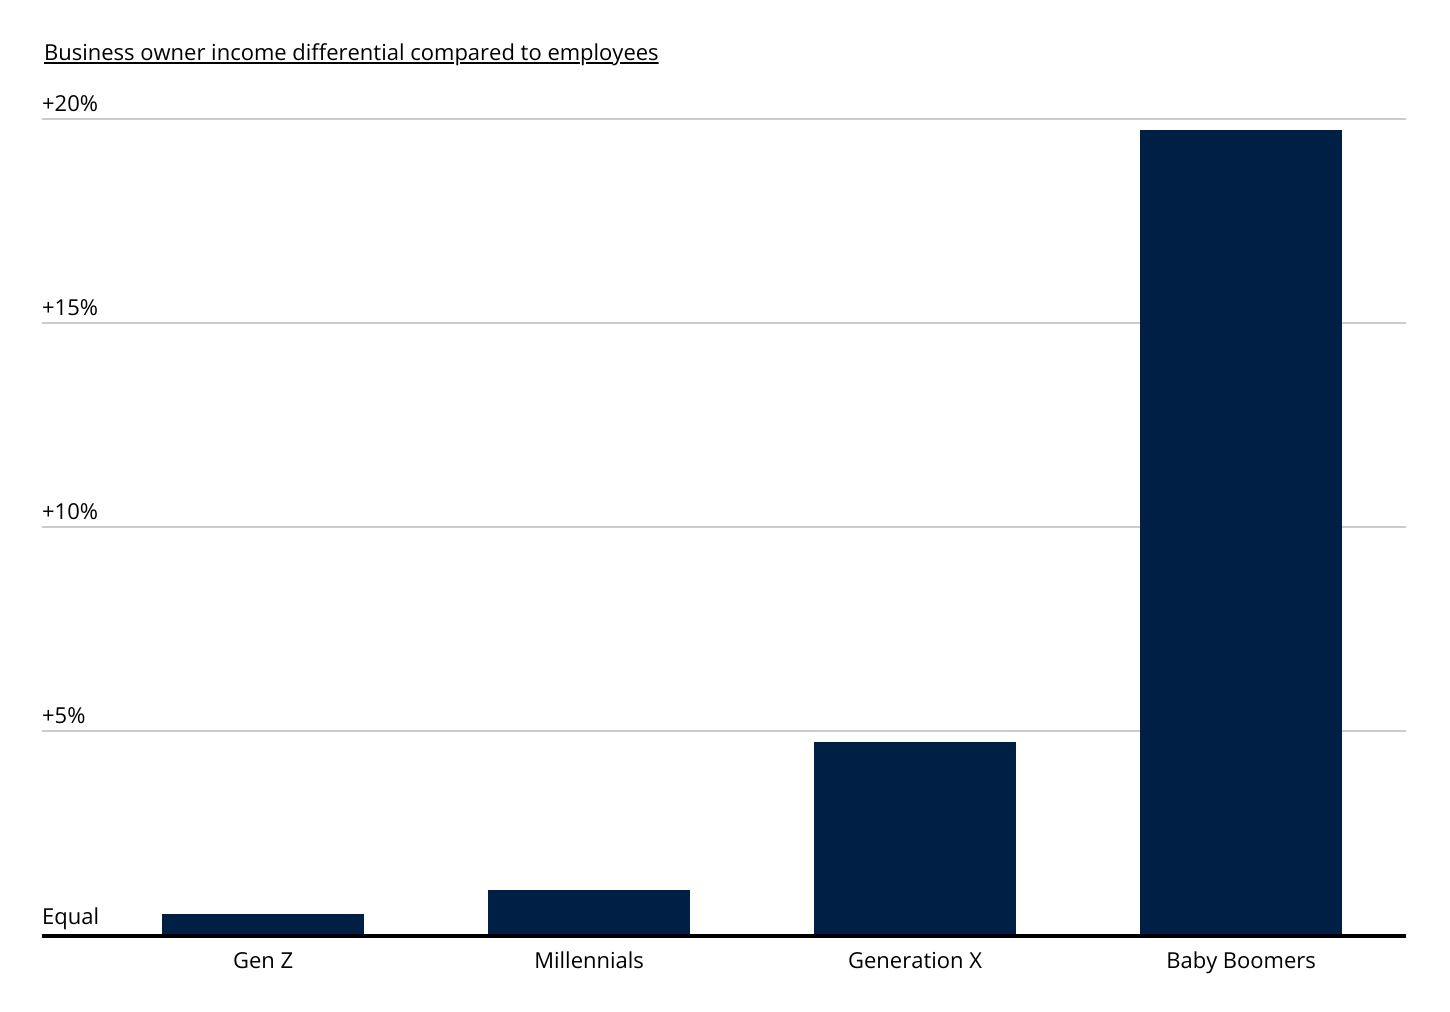
Business Owner Income Differential by Generation
Baby Boomer business owners earn significantly more than their employee counterparts
Source: Flippa analysis of U.S. Census Bureau’s American Community Survey data | Image Credit: Flippa
Millennial business owners lag behind older business owners not just in income overall but in income relative to non-business owners. A typical baby boomer who owns a business earns nearly 20% more than one working as an employee, while for Generation X, a typical business owner earns 4.7% more than an employee. For millennials, however, the difference between business owners and employees is just 1.1%—around just $700 per year.
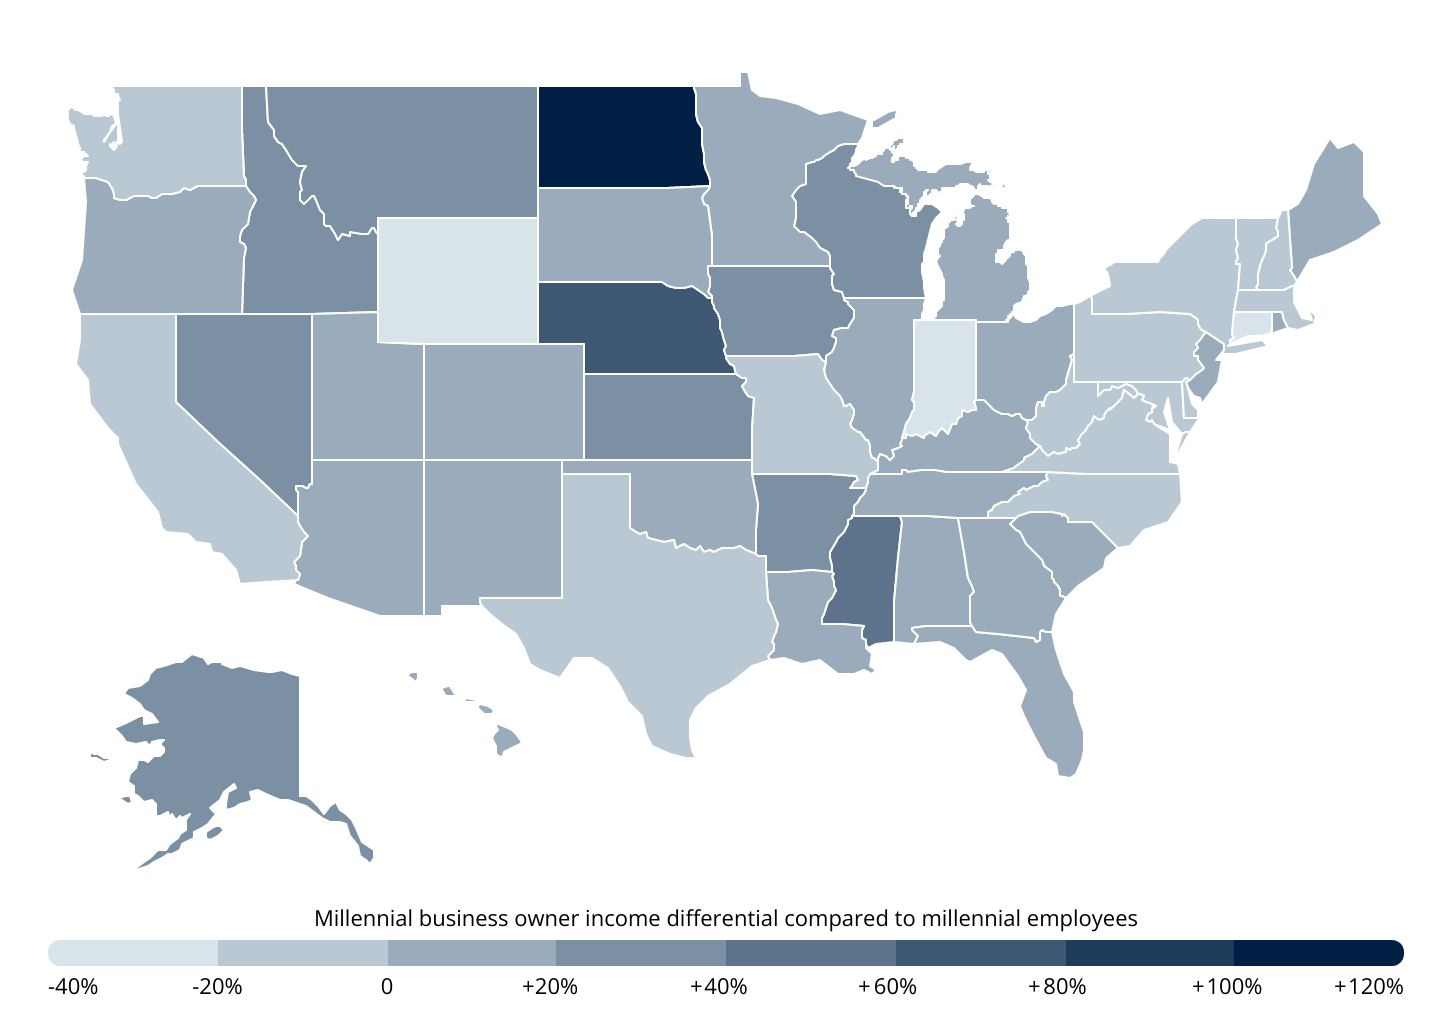
Millennial Business Owner Income by Location
Millennial business owners in North Dakota earn the most compared to their employee counterparts
Source: Flippa analysis of U.S. Census Bureau’s American Community Survey data | Image Credit: Flippa
For millennials in some parts of the country, however, business ownership can prove much more lucrative than working as an employee. In North Dakota, the typical millennial business owner earns more than twice what their employee counterparts do, and in other states like Nebraska (+63.6%), Mississippi (+40.4%), and Kansas (+38.9%), business owners maintain a substantial earning premium. But in 16 states, millennial business owners earn less than millennial employees, including Wyoming (-27.3%), Connecticut (-25.3%), and Massachusetts (-16.0%).
One factor that may impact the income differential is the quality of jobs available for employees. At the metro level, some of the locations with the most favorable differential for employees are full of jobs with generous pay, like finance jobs in Bridgeport, CT (-33.5% differential for business owners) or tech jobs in San Francisco (-33.2%). The cities that have the best differential for millennial business owners are locations where higher-paying industries are not as well established, lowering the opportunity costs for potential entrepreneurs.
Below is a complete breakdown of the areas with the most successful millennial business owners across the top 100 metros and all 50 states. The analysis was conducted by researchers at Flippa, a global online marketplace to buy and sell online businesses and digital assets, using data from the U.S. Census Bureau. For more information on how each statistic was computed, refer to the methodology section below.

Photo Credit: f11photo / Shutterstock
15. Portland-South Portland, ME
- Millennial business owner income differential: +21.8%
- Average income for millennial business owners: $82,182
- Average income for millennial employees: $67,489
- Percentage of millennial workers that are business owners: 9.6%
- Percentage of population that are millennials: 21.7%
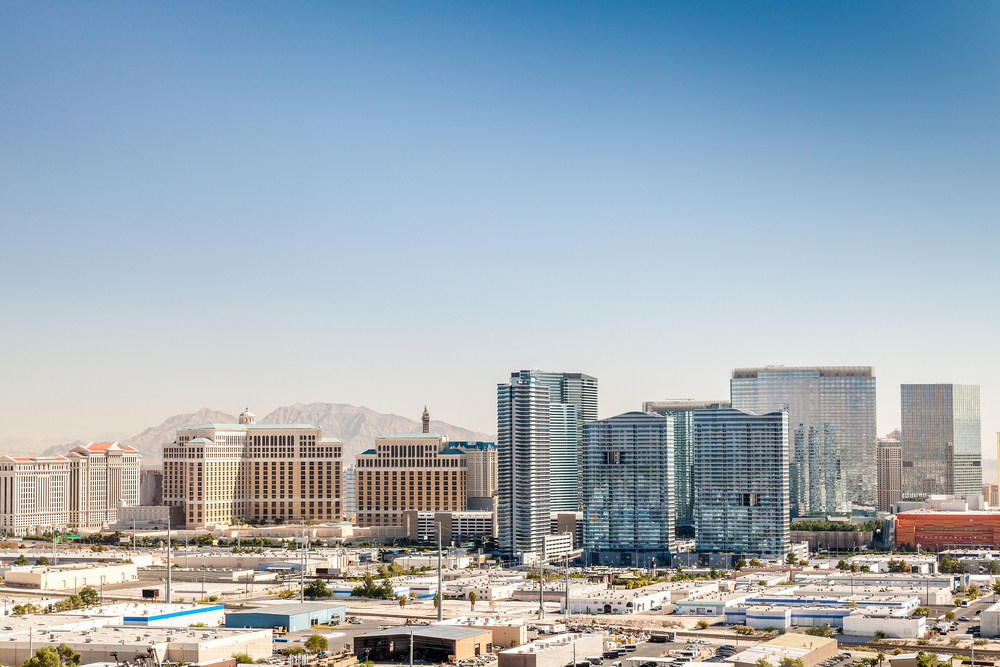
Photo Credit: Sopotnicki / Shutterstock
14. Las Vegas-Henderson-North Las Vegas, NV
- Millennial business owner income differential: +26.1%
- Average income for millennial business owners: $64,676
- Average income for millennial employees: $51,286
- Percentage of millennial workers that are business owners: 8.2%
- Percentage of population that are millennials: 23.3%

Photo Credit: Rob Hainer / Shutterstock
13. Lakeland-Winter Haven, FL
- Millennial business owner income differential: +26.7%
- Average income for millennial business owners: $57,714
- Average income for millennial employees: $45,534
- Percentage of millennial workers that are business owners: 7.4%
- Percentage of population that are millennials: 21.4%
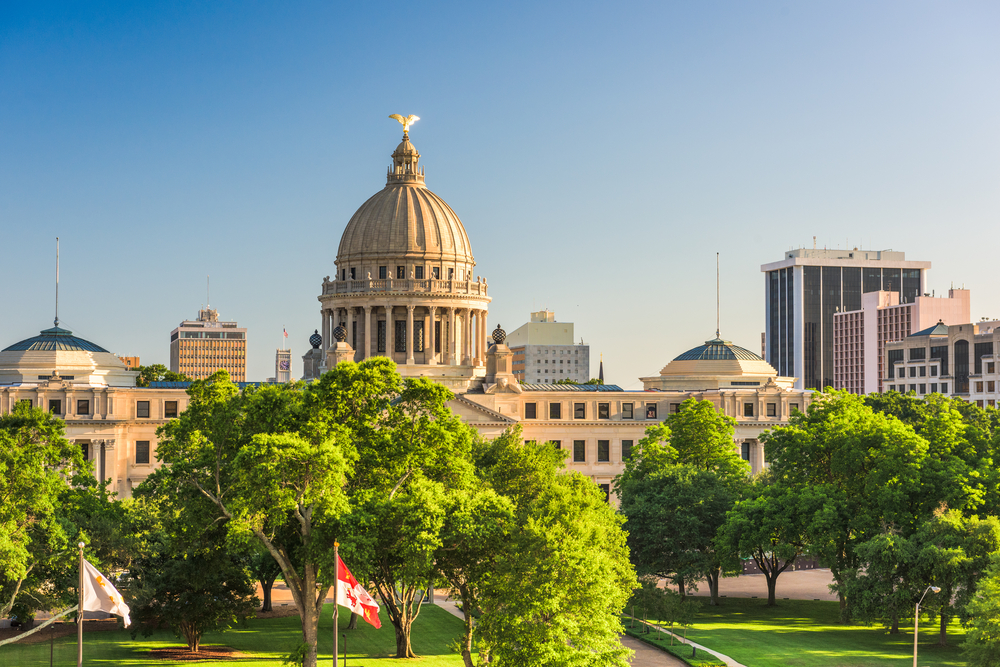
Photo Credit: Sean Pavone / Shutterstock
12. Jackson, MS
- Millennial business owner income differential: +28.0%
- Average income for millennial business owners: $65,973
- Average income for millennial employees: $51,538
- Percentage of millennial workers that are business owners: 10.5%
- Percentage of population that are millennials: 19.9%
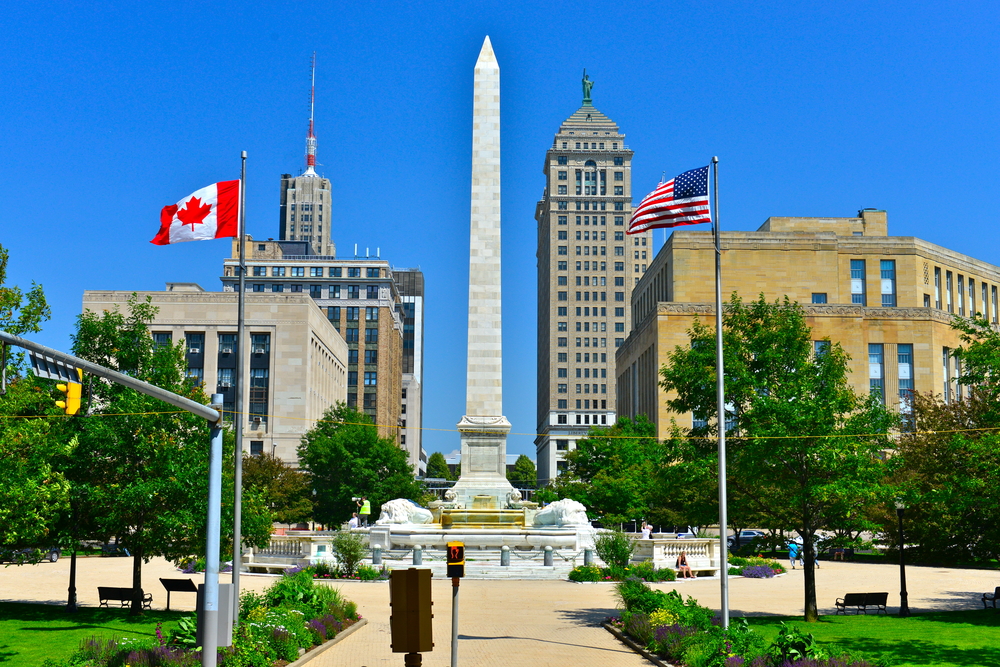
Photo Credit: Richard Cavalleri / Shutterstock
11. Buffalo-Cheektowaga, NY
- Millennial business owner income differential: +28.2%
- Average income for millennial business owners: $71,887
- Average income for millennial employees: $56,093
- Percentage of millennial workers that are business owners: 5.6%
- Percentage of population that are millennials: 20.7%
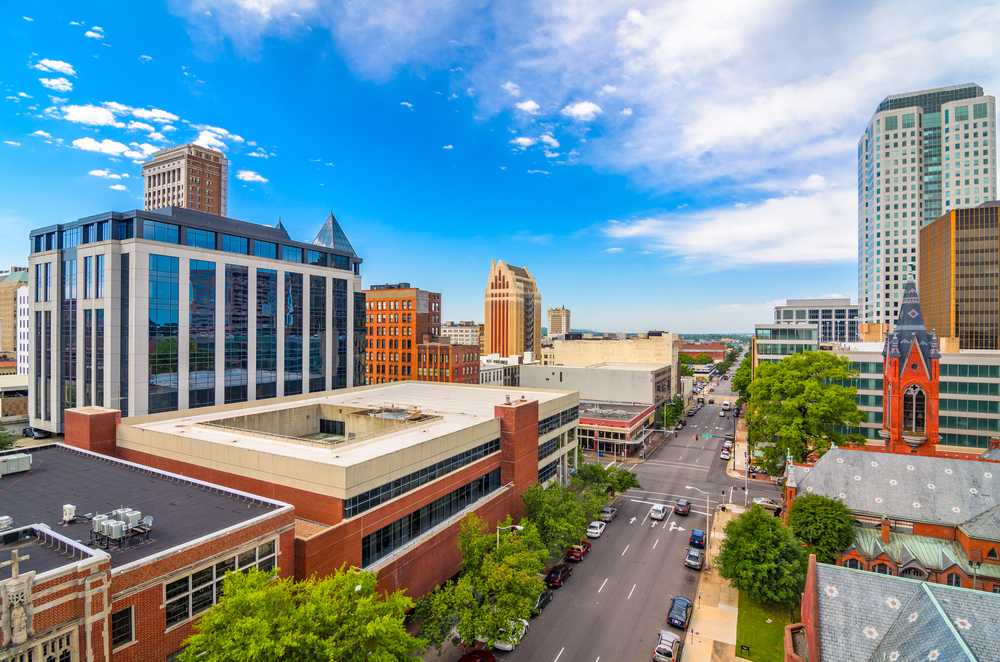
Photo Credit: Sean Pavone / Shutterstock
10. Birmingham, AL
- Millennial business owner income differential: +28.8%
- Average income for millennial business owners: $72,735
- Average income for millennial employees: $56,470
- Percentage of millennial workers that are business owners: 8.4%
- Percentage of population that are millennials: 20.8%

Photo Credit: Izabela23 / Shutterstock
9. Urban Honolulu, HI
- Millennial business owner income differential: +29.3%
- Average income for millennial business owners: $75,615
- Average income for millennial employees: $58,458
- Percentage of millennial workers that are business owners: 7.7%
- Percentage of population that are millennials: 22.0%
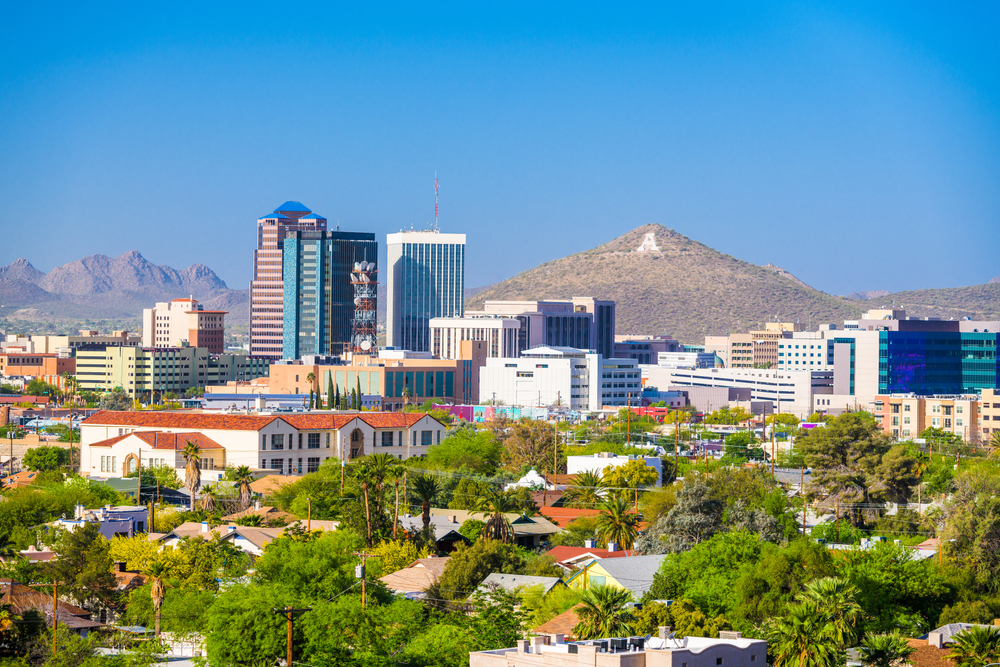
Photo Credit: Sean Pavone / Shutterstock
8. Tucson, AZ
- Millennial business owner income differential: +29.4%
- Average income for millennial business owners: $63,458
- Average income for millennial employees: $49,040
- Percentage of millennial workers that are business owners: 8.2%
- Percentage of population that are millennials: 19.7%
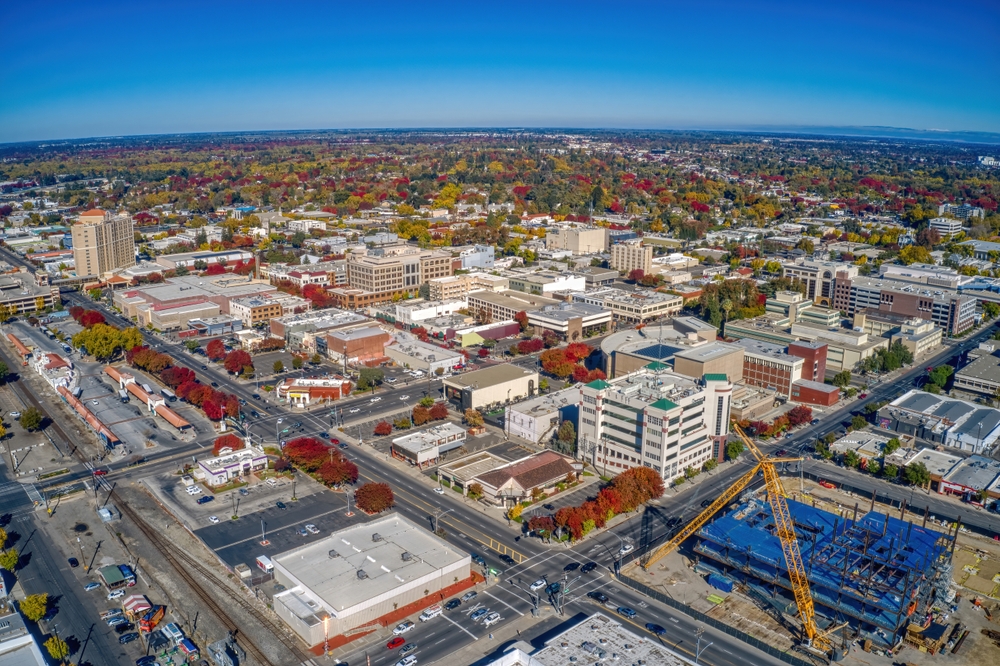
Photo Credit: Jacob Boomsma / Shutterstock
7. Modesto, CA
- Millennial business owner income differential: +32.8%
- Average income for millennial business owners: $69,858
- Average income for millennial employees: $52,588
- Percentage of millennial workers that are business owners: 7.9%
- Percentage of population that are millennials: 23.0%
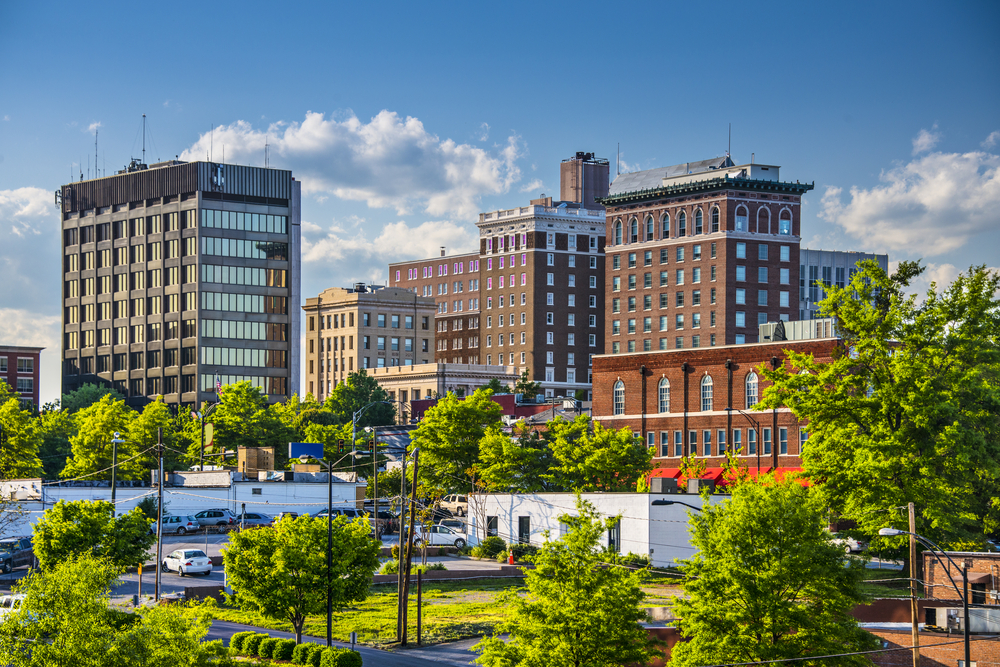
Photo Credit: Sean Pavone / Shutterstock
6. Greenville-Anderson-Greer, SC
- Millennial business owner income differential: +45.2%
- Average income for millennial business owners: $78,675
- Average income for millennial employees: $54,174
- Percentage of millennial workers that are business owners: 9.1%
- Percentage of population that are millennials: 20.3%
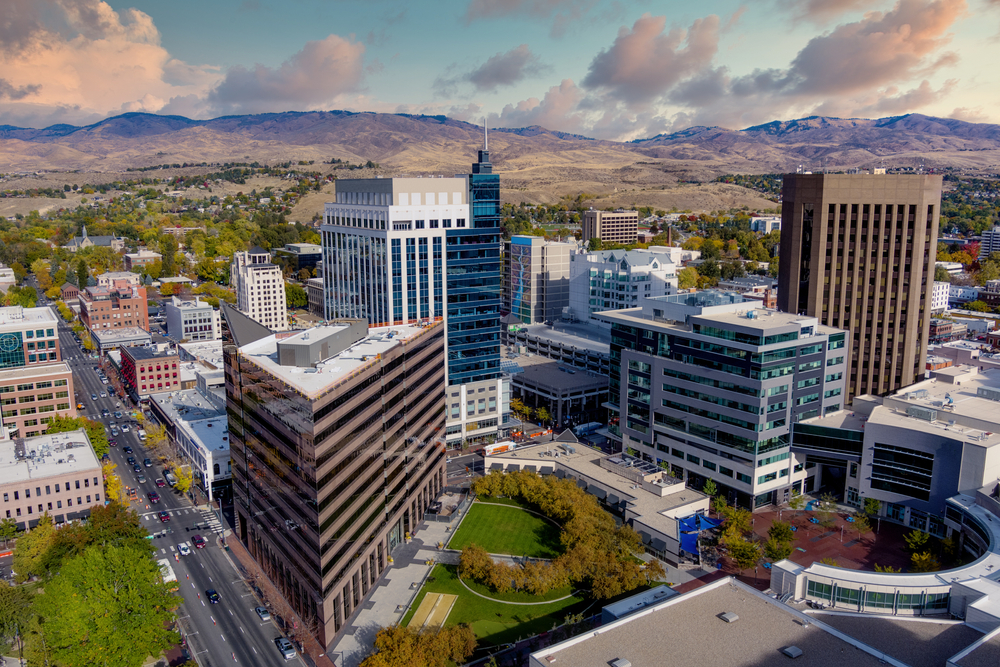
Photo Credit: Charles Knowles / Shutterstock
5. Boise City, ID
- Millennial business owner income differential: +45.2%
- Average income for millennial business owners: $79,612
- Average income for millennial employees: $54,846
- Percentage of millennial workers that are business owners: 8.9%
- Percentage of population that are millennials: 21.3%
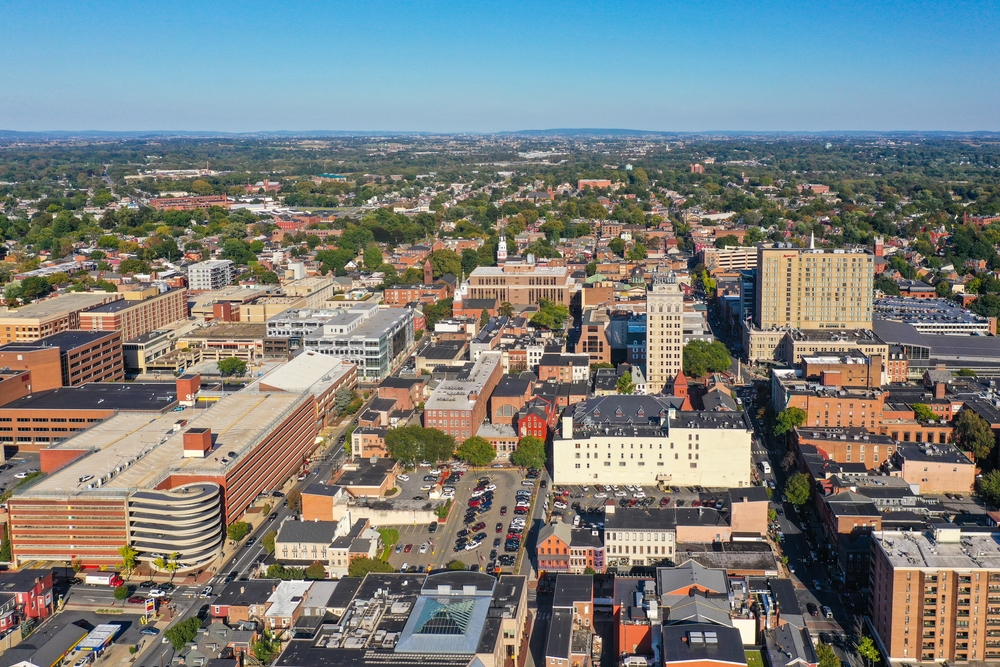
Photo Credit: Hutch Photography / Shutterstock
4. Lancaster, PA
- Millennial business owner income differential: +53.9%
- Average income for millennial business owners: $92,518
- Average income for millennial employees: $60,102
- Percentage of millennial workers that are business owners: 8.4%
- Percentage of population that are millennials: 20.8%

Photo Credit: Sean Pavone / Shutterstock
3. Wichita, KS
- Millennial business owner income differential: +75.7%
- Average income for millennial business owners: $84,863
- Average income for millennial employees: $48,294
- Percentage of millennial workers that are business owners: 6.0%
- Percentage of population that are millennials: 21.3%
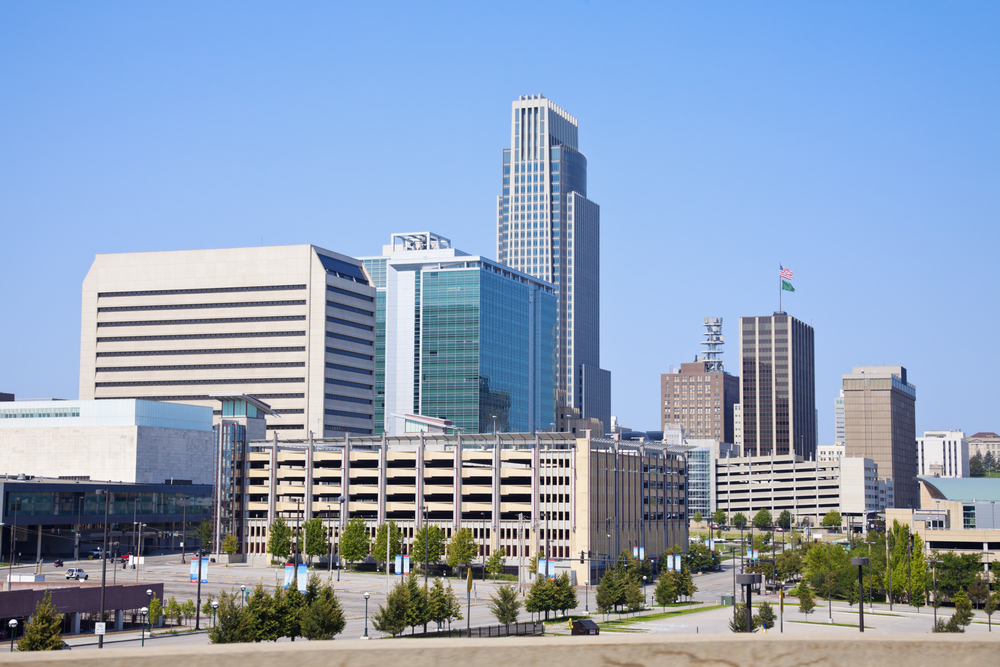
Photo Credit: Henryk Sadura / Shutterstock
2. Omaha, NE-IA
- Millennial business owner income differential: +83.5%
- Average income for millennial business owners: $110,414
- Average income for millennial employees: $60,156
- Percentage of millennial workers that are business owners: 6.3%
- Percentage of population that are millennials: 23.4%

Photo Credit: Kirk Fisher / Shutterstock
1. Spokane-Spokane Valley, WA
- Millennial business owner income differential: +90.6%
- Average income for millennial business owners: $101,258
- Average income for millennial employees: $53,113
- Percentage of millennial workers that are business owners: 7.4%
- Percentage of population that are millennials: 23.4%
Methodology

Photo Credit: Monkey Business Images / Shutterstock
To find the locations with the most successful millennial business owners, researchers at Flippa analyzed the latest data from the U.S. Census Bureau’s 2022 American Community Survey. The researchers ranked metros according to the difference between the average income for self-employed and employee millennials. Millennial workers were those individuals ages 26 to 41 in the year 2022 who worked and earned income in the prior 12 months. To improve relevance, only the top 100 metropolitan areas by population were considered for the analysis.
For complete results, see How Much Do Millennial Business Owners Make? on Flippa.


